Difference between revisions of "GanttPage"
m (8 revisions imported) |
(Added export section) |
||
| Line 166: | Line 166: | ||
Example:<br/> | Example:<br/> | ||
To override the field used for Title, add ''&Gantt.Field.Title=[field-name]'' to the url | To override the field used for Title, add ''&Gantt.Field.Title=[field-name]'' to the url | ||
== Exporting == | |||
The chart supports exporting to Excel and iCal formats. | |||
It's possible to overwrite the export, be declaring a javascript function named <code>customExportToExcel</code> or <code>customExportToICal</code>. Either takes one argument: the gantt object. | |||
Heres an example that removes html markup from the gantt titles before export.<syntaxhighlight lang="javascript" line="1"> | |||
function customExportToExcel(gantt) { | |||
var data = gantt.getDatastore("task").getVisibleItems(); | |||
var rtn = []; | |||
for (var i = 0; i < data.length; i++) { | |||
var d = new Date(data[i].start_date); | |||
rtn[i] = { | |||
color: data[i].color, | |||
duration: data[i].duration, | |||
id: data[i].id, | |||
open: data[i].open, | |||
parent: (data[i].parent == "0" || data[i].parent == 0 ? "" : data[i].parent), | |||
progress: data[i].progress, | |||
start_date: d.getFullYear() + "-" + ("0"+(d.getMonth()+1)).slice(-2) + "-" + ("0" + d.getDate()).slice(-2) + " " + ("0" + d.getHours()).slice(-2) + ":" + ("0" + d.getMinutes()).slice(-2), | |||
text: $(data[i].text).text(), | |||
}; | |||
} | |||
console.log(rtn); | |||
viewGantt({data: rtn, links: []}); | |||
setTimeout(function() { | |||
gantt.exportToExcel(); | |||
}, 5); | |||
setTimeout(loadGantt, 100); | |||
} | |||
</syntaxhighlight> | |||
Latest revision as of 11:05, 4 July 2023
About
The platform has a build-in gantt chart generator.
It supports zooming, nesting and relations.
The datastructure has to be a single entity.
If your data isn't contained in a single entity use Gantt Sync CodeUnit.
Sample
Basic setup
To view a gantt chart, first access the page main?command=dk.tempusserva.gantt.DhtmlXGanttPage to generate the required static configurations.
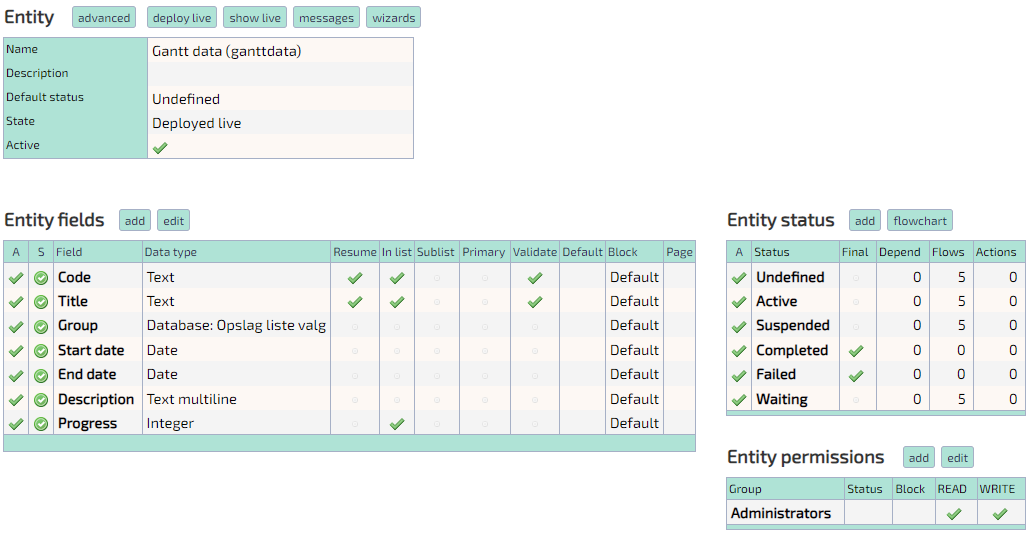
Six fields are required in the table, that the data is being read from:
Code, Title, Group, Start date, End date and Progress.
Code and Title have to be single-line text inputs.
Progress has to be an integer input, it represents how far along the task is, in percent.
Start and End date have to be dates.
Group should store the DataID of the parent-task. Here a database-lookup is used, executing query: SELECT DataID, Resume FROM data_ganttdata and displaying field Resume.
Also at least 5 statuses:
Active, Suspended, Completed, Failed and Waiting.
All other statuses will be marked as Undefined.
To view the gantt chart, access: main?command=dk.tempusserva.gantt.DhtmlXGanttPage&SagID=[SagID]
Sample
Relations
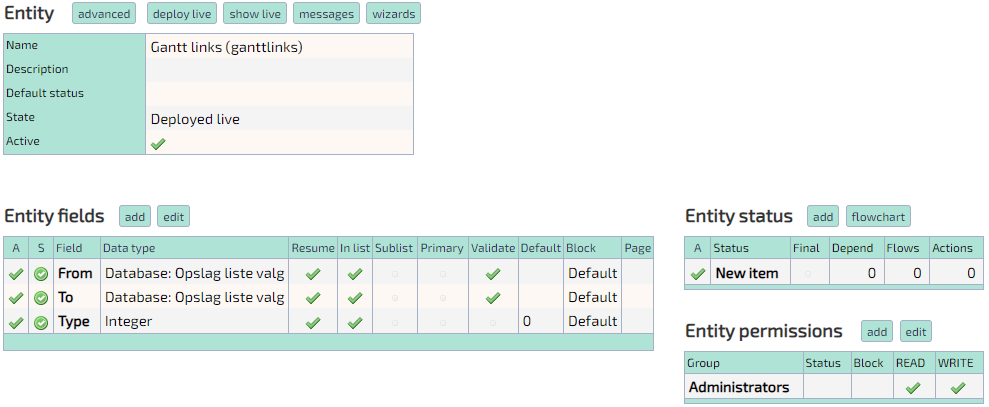
To view relations between tasks, create another table.
Two fields are required:
From and To.
A third field Type can be added, but isn't required.
From and To have to store the DataID of the tasks that should be linked via a relation. This setup is the same as Group.
Type has to have value of 1 or 0, any other value is overwritten to 0. This defines whether the relation is drawn from the beginning (1) or end (0) of the From-task.
To view the gantt chart, access: main?command=dk.tempusserva.gantt.DhtmlXGanttPage&SagID=[SagID]&LinkSagID=[RelationSagID]
Sample
All configurations
| Static config | Default value | Description |
| Gantt.Field.Group | GROUP_VALUE | Name of the column that contains the DataID of parent-task |
| Gantt.Field.StartDate | STARTDATE | Name of the column that contains the task-start date |
| Gantt.Field.EndDate | ENDDATE | Name of the column that contains the task-end date |
| Gantt.Field.Code | CODE | Name of the column that contains the task-code |
| Gantt.Field.Title | TITLE | Name of the column that contains the task-title |
| Gantt.Field.Progress | PROGRESS | Name of the column that contains the task-progress |
| Gantt.Filter.Field | TASKTYPE | Name of a column that contains a value that should be filtered to match Gantt.Filter.Value |
| Gantt.Filter.Value | 249 | Value that task have to equal in column Gantt.Filter.Field |
| Gantt.Field.Link.From | FROM | Name of column that contains DataID of source-task in a relation |
| Gantt.Field.Link.To | TO | Name of column that contains DataID of target-task in a relation |
| Gantt.Field.Link.Type | Name of column that contains type of relation, not required | |
| Gantt.StatusID.Active | 1 | ID of status that marks a task as Active |
| Gantt.StatusID.Waiting | 2 | ID of status that marks a task as Waiting |
| Gantt.StatusID.Suspended | 3 | ID of status that marks a task as Suspended |
| Gantt.StatusID.Completed | 4 | ID of status that marks a task as Completed |
| Gantt.StatusID.Failed | 5 | ID of status that marks a task as Failed |
| Gantt.StatusColor.Undefined | #858586 | CSS-color of tasks with status Undefined |
| Gantt.StatusColor.Active | #76C0F1 | CSS-color of tasks with status Active |
| Gantt.StatusColor.Waiting | #F6BF5F | CSS-color of tasks with status Waiting |
| Gantt.StatusColor.Suspended | #F28F42 | CSS-color of tasks with status Suspended |
| Gantt.StatusColor.Completed | #4DBE6C | CSS-color of tasks with status Completed |
| Gantt.StatusColor.Failed | #E70015 | CSS-color of tasks with status Failed |
Advanced usage
It's possible to override the static content.
To do so, add the desired value to the url.
Example:
To override the field used for Title, add &Gantt.Field.Title=[field-name] to the url
Exporting
The chart supports exporting to Excel and iCal formats.
It's possible to overwrite the export, be declaring a javascript function named customExportToExcel or customExportToICal. Either takes one argument: the gantt object.
Heres an example that removes html markup from the gantt titles before export.
function customExportToExcel(gantt) {
	var data = gantt.getDatastore("task").getVisibleItems();
	var rtn = [];
	for (var i = 0; i < data.length; i++) {
		var d = new Date(data[i].start_date);
		rtn[i] = {
			color: data[i].color,
			duration: data[i].duration,
			id: data[i].id,
			open: data[i].open,
			parent: (data[i].parent == "0" || data[i].parent == 0 ? "" : data[i].parent),
			progress: data[i].progress,
			start_date: d.getFullYear() + "-" + ("0"+(d.getMonth()+1)).slice(-2) + "-" + ("0" + d.getDate()).slice(-2) + " " + ("0" + d.getHours()).slice(-2) + ":" + ("0" + d.getMinutes()).slice(-2),
			text: $(data[i].text).text(),
		};
	}
	console.log(rtn);
	viewGantt({data: rtn, links: []});
	setTimeout(function() {
		gantt.exportToExcel();
	}, 5);
	setTimeout(loadGantt, 100);
}


